The survey is administered through tailored modules for each respondent group to capture comprehensive, multi‑level data.
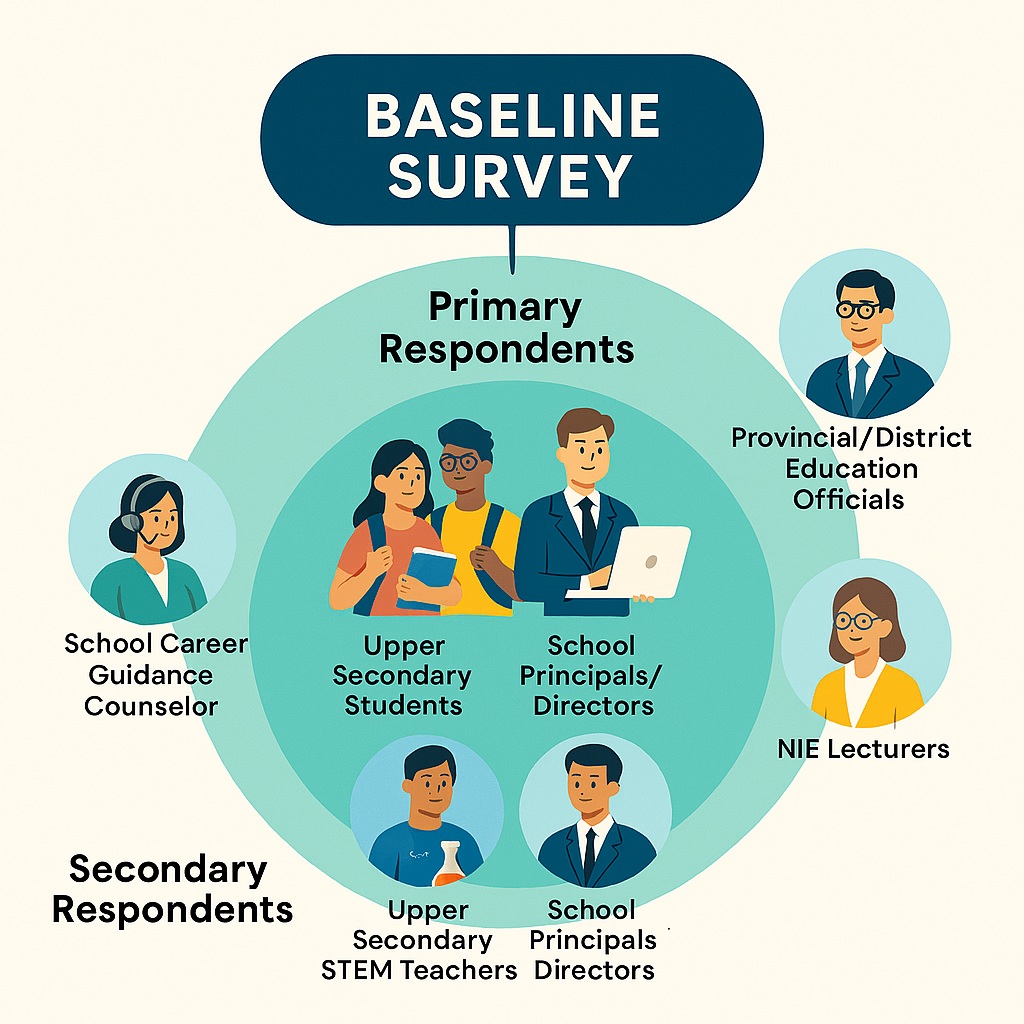
Primary respondents
-
School Principals/Directors: School management capacity, leadership, resource availability, STEM policies, and infrastructure status.
-
Upper Secondary STEM Teachers: (Physics, Chemistry, Biology, Mathematics, ICT, Earth Sciences) teaching practices, pedagogy, confidence, EdTech use, CPD access, and resource perceptions.
-
Upper Secondary Students (Grades 10–12): STEM interest and attitudes, perceived teaching quality, access to resources, career aspirations, and participation in STEM activities.
Secondary respondents
-
School Career Guidance Counselors: Current career guidance practices, especially for STEM, and linkages with tertiary education and industry.
-
POE/DOE Officials: Data management capacity (pre‑OpenEMIS), monitoring roles, and support for STEM and EdTech initiatives.
-
NIE Lecturers: PRESET curriculum baseline, STEM pedagogy, and technology integration in pre‑service training.
Graphic: Respondent Map
Concentric circles with students, teachers, and principals at the core, and counselors, POE/DOE, and NIE lecturers in outer rings, all pointing toward “Baseline Survey”.
A stratified random sampling approach is used to ensure the sample reflects Cambodia’s diverse school contexts.
Stratification
- School type: USSs, GTHSs, SRS, NGS.
- Geographic location: Urban, peri‑urban, rural.
- Province: Representation across regions.
Selection process
- A statistically significant number of schools is randomly selected within each stratum.
-
Within each selected school:
- Principal and Career Guidance Counselor surveyed (census).
- Random sample of 2–4 STEM teachers (depending on school size).
- One or two classes per grade (10, 11, 12) randomly selected for student surveys.
- Relevant POE/DOE officials and NIE lecturers purposively selected based on roles.
Graphic: Sampling Funnel
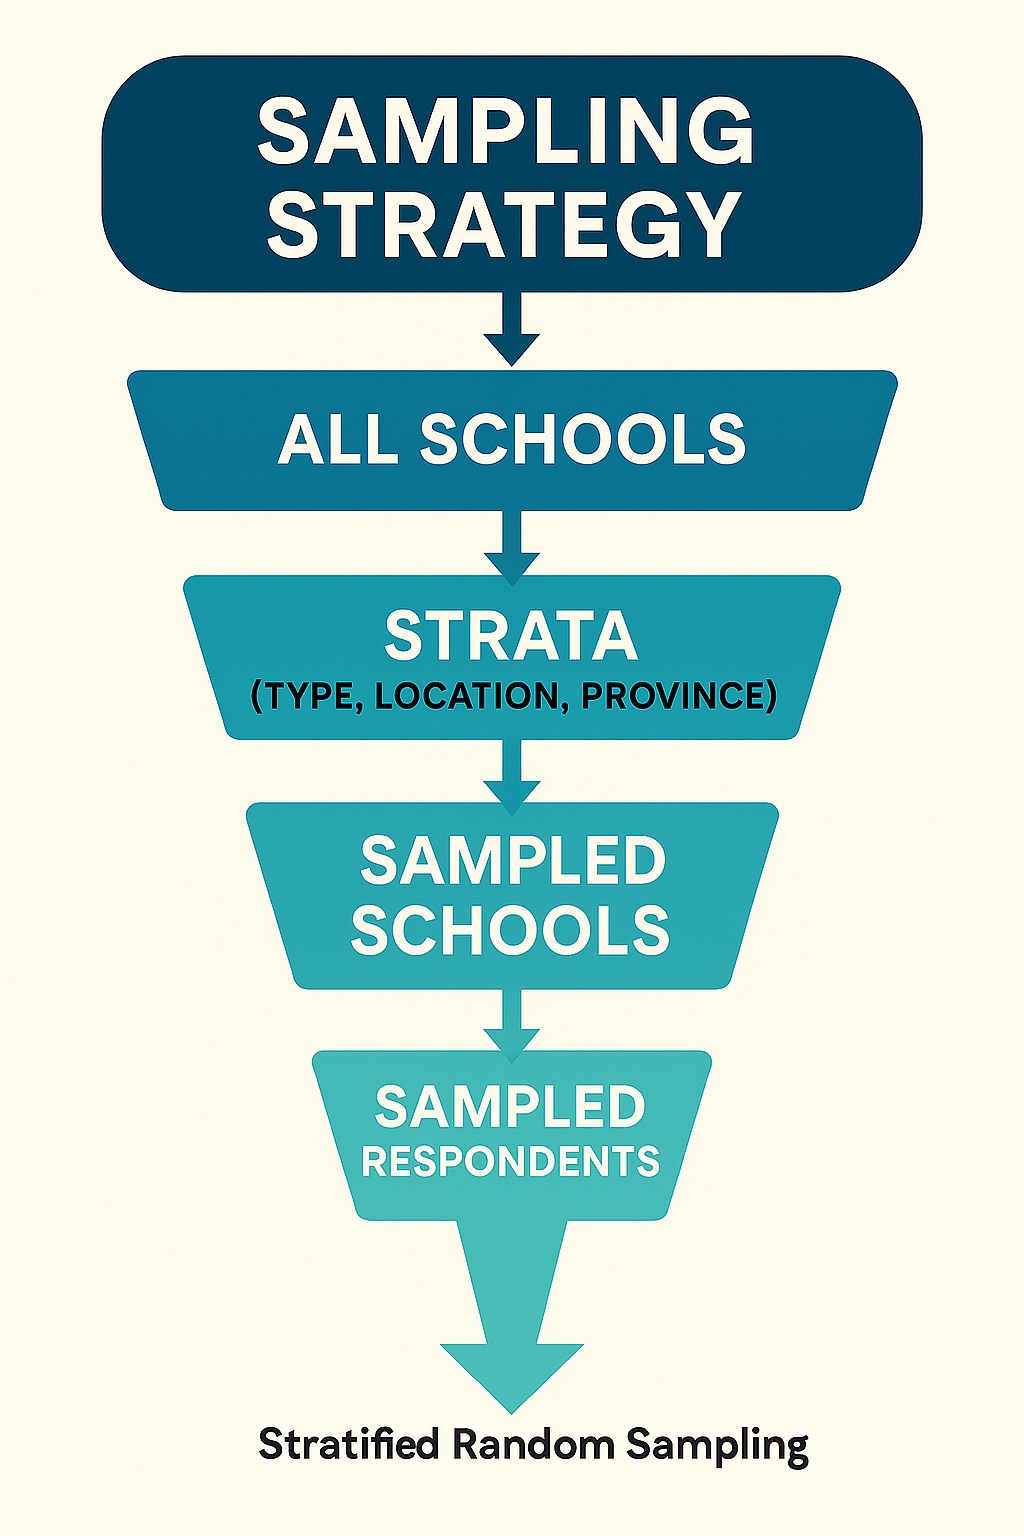
Funnel diagram: “All Schools” → “Strata (Type, Location, Province)” → “Sampled Schools” → “Sampled Respondents”.
Theme A: School leadership, management, and STEM focus
Target: School Principals
- A1. School planning: STEM objectives in school improvement plan (Yes/No + details).
- A2. Resource allocation: % of non‑salary budget for STEM resources.
- A3. Teacher support: Rating of support for STEM CPD (1–5).
- A4. Community engagement: Number of STEM‑related outreach/parent activities.
Theme B: STEM teaching and learning environment
Target: STEM Teachers, Students
For teachers:
- B1. Teaching practices: Frequency of methods (lecture, group work, experiments, PBL, ICT) – 5‑point scale.
- B2. Teacher confidence: Confidence in STEM content, lab safety, digital tools, competency‑based assessment – 1–5 scale.
- B3. Lab safety: Existence of clear lab safety guidelines (Yes/No).
For students:
- B4. Student interest: Interest in STEM careers – 1–5 scale.
- B5. Learning experience: Perception that teachers encourage questions and experimentation – 1–5 scale.
- B6. Practical application: Frequency of hands‑on experiments/practical activities – 5‑point frequency scale.
Theme C: Teacher professional development (CPD)
Target: STEM Teachers, School Principals
- C1. Recent training: Days of STEM/EdTech CPD in last 12 months.
- C2. Training relevance: Relevance of most recent CPD to daily teaching – 1–5 scale.
- C3. PLCs: Existence of active STEM PLCs (Yes/No).
Theme D: Infrastructure, resources, and EdTech
Target: School Principals, STEM Teachers
- D1. Laboratory availability: Physics, Chemistry, Biology labs – Not available / Available but not functional / Available and functional.
- D2. Safety equipment: Condition of fire extinguishers, first aid kits, goggles, fume hoods – Good / Needs repair / Not available.
- D3. ICT availability: Number of functional student computers.
- D4. Internet connectivity: Quality and reliability – 1–5 scale.
- D5. Data management: System used – paper, Excel, digital system, don’t know.
Theme E: Gender equality and social inclusion (GESI)
Target: All respondents (adapted per group)
- E1. Enrollment data: Grade 12 students by gender (principals).
- E2. Inclusive environment: Perception that school encourages girls in STEM – 1–5 scale.
- E3. Teacher training: Training on gender‑responsive pedagogy/inclusive practices (teachers) – Yes/No.
- E4. Accessibility: Infrastructure for students with physical disabilities – Yes/No.
- E5. Demographics: Gender, ethnicity (including indigenous peoples), disability status – categorical.
Theme F: Career guidance and industry linkages
Target: Career Counselors, Students, Principals
- F1. Program availability: Existence of structured career guidance program – Yes/No.
- F2. STEM career information: Number of STEM career information events in last year.
- F3. Student awareness: Awareness of STEM jobs and careers – 1–5 scale.
- F4. Partnerships: Partnerships with private sector or tertiary institutions related to STEM – Yes/No.
Graphic: Theme Overview Grid
3×2 grid with icons for each theme: leadership, classroom, CPD, infrastructure, GESI, careers, each labeled with its main focus.
-
Likert scales (5‑point): Perceptions, attitudes, confidence, agreement (e.g., Strongly Disagree to Strongly Agree).
-
Binary (Yes/No): Existence or availability of programs, resources, or policies.
-
Numerical values: Counts, percentages, frequencies (e.g., students, budget %, training days).
-
Categorical / multiple choice: Demographics and system types (e.g., data management systems).
-
Checklists: Infrastructure and resource audits (e.g., lab equipment, safety features).
-
Data disaggregation: All data structured for disaggregation by gender, school type, location, and beneficiary group (e.g., indigenous peoples).
Graphic: Measurement Toolkit
Icons for scales, checkboxes, numbers, and category tags, with a filter icon labeled “Disaggregation” to show slicing by gender, location, and group.